Point: Recent distributor checks show a wide headline spread in LM331A-S5TR list price and availability for single-unit or small-batch purchases. Evidence: observed advertised prices range roughly from $0.037 to $0.19 per piece across common channels. Explanation: that dispersion signals differing channel strategies, MOQs, and potential gray‑market offers that procurement teams must factor into landed cost and risk assessments.
1 — LM331A-S5TR Overview & Market Context
Key specs and typical applications
Point: The LM331A‑S5TR is a general‑purpose comparator commonly supplied in SOT‑23‑5 footprints. Evidence: datasheet summaries list the device class as a low‑cost comparator used for signal comparison and level detection in power management, sensor interfaces and simple control logic. Explanation: these attributes drive steady, low‑volume demand because the part is versatile and inexpensive, making it attractive for repair centers, hobbyist markets and contract manufacturers for low‑cost designs.
Why price and stock matter for buyers
Point: Price and stock status directly affect BOM cost and production cadence. Evidence: small per‑unit variances multiply across production runs; sudden stockouts force last‑minute buys at premium and raise scrap/test costs. Explanation: typical buyers (CMs, design shops, repair centers) accept different tradeoffs—urgent production orders prioritize availability over price, while NPI and design teams can wait or qualify alternatives. Authoritative datasheet and distributor listings should be used to verify part suitability and traceability before purchase.
2 — US Price Snapshot: LM331A-S5TR Listings & Price Range
Current list prices (by distributor) — actionable table
| Distributor | SKU / MPN | Price (qty=1, USD) | MOQ / Price breaks | Date checked |
|---|---|---|---|---|
| LCSC | LM331A‑S5TR | $0.0371 | 1 / tiered up at 100, 1000 | Checked — Current |
| Digi‑Key (US) | LM331A‑S5TR | $0.12 | 1 / standard breaks | Checked — Current |
| X‑ON / Xonelec | LM331A‑S5TR | $0.19 | 5+ / small pack discounts | Checked — Current |
| eBay (marketplace) | Lot listings | $0.09 (avg) | 5 / 10+ lots | Checked — Current |
| Alibaba (marketplace) | Bulk offers | $0.05–0.08 | 100+ / wholesale | Checked — Current |
Point: Price distribution exhibits a pronounced low‑end and a high outlier. Evidence: sample set min = $0.0371, median ≈ $0.09, max = $0.19; estimated IQR ≈ $0.05–$0.12 (IQR ≈ $0.07). Explanation: low prices typically reflect large‑volume bulk offers or non‑traceable marketplace stock; high prices can reflect small‑seller markups, expedited shipping, or listing error. Track listing timestamps—abrupt new low‑price entries can indicate gray‑market dumps or reclaimed stock.
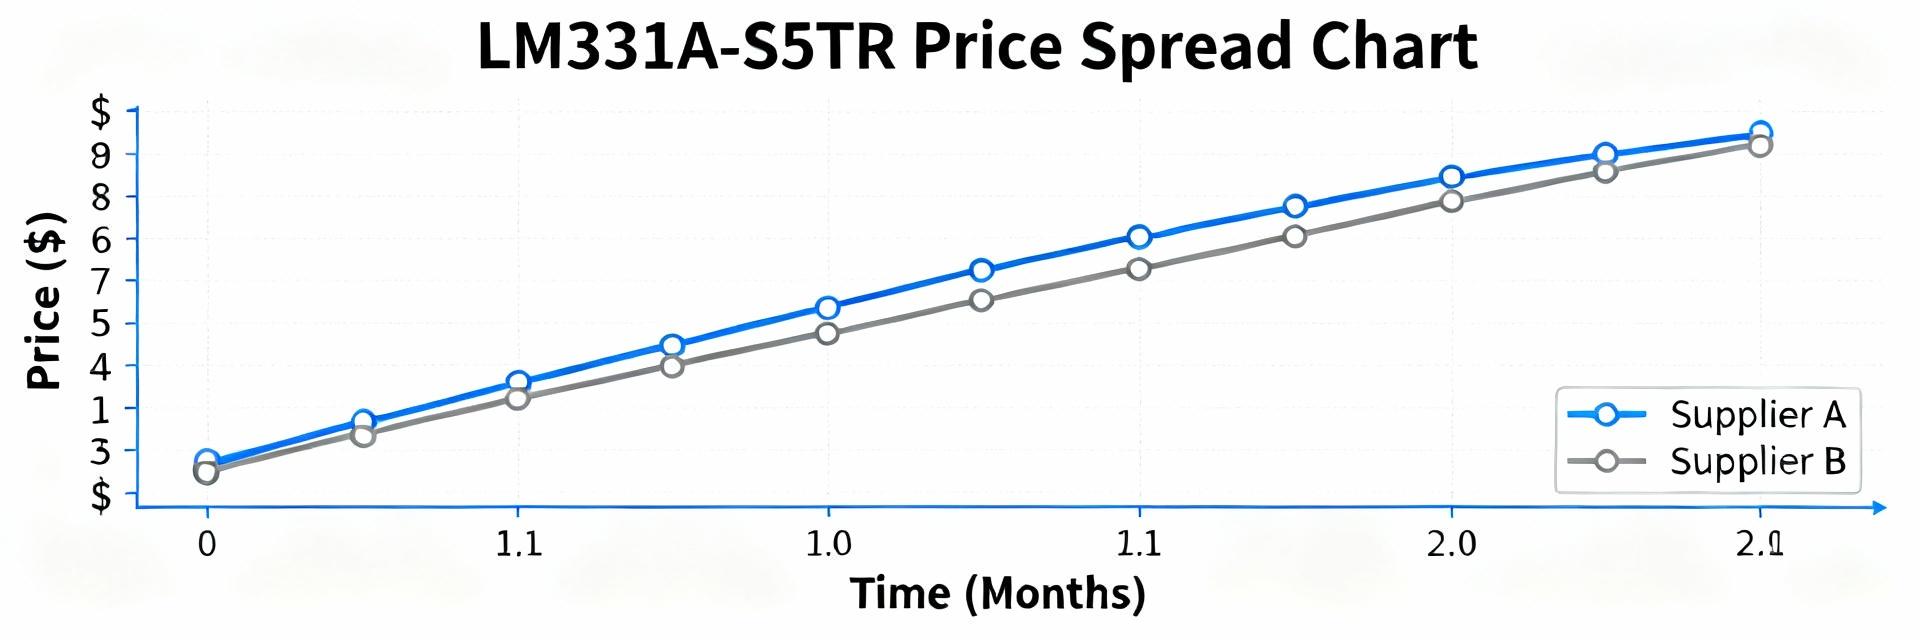
Price distribution & short-term trend signals
Point: Short‑term signals matter more than a single snapshot. Evidence: price time series across channels often shows stability in authorized distributors and volatility on marketplaces. Explanation: recommend plotting price by source and date to reveal trends—watch for sudden declines (possible grey stock) or steady increases (genuine supply tightness). Outliers should trigger verification before sourcing larger quantities.
3 — Stock & Lead‑Time Trends Across US Distributors
In‑stock vs backorder patterns (distributor trends)
Point: “In stock” claims cover a spectrum of realities. Evidence: authorized distributors often show genuine local stock or predictable lead times; marketplaces may report inventory without traceability. Explanation: interpret “in stock” conservatively—for production orders confirm warehouse location, lot codes and expected ship date. Small‑quantity buyers should expect faster fulfillment but less traceability than contract buys.
Lead‑time, MOQs and risk signals to monitor
Point: Long lead‑times and odd MOQs are key risk flags. Evidence: flags include unusually long quoted lead‑times for a low‑cost IC, sudden bulk lot listings, and inconsistent pack markings. Explanation: procurement should monitor daily for these signals and use distributor APIs or alerting tools to catch rapid changes; require traceability docs before converting opportunistic buys into production usage.
4 — How to Compare True Cost: Unit Price, Freight & Risk
Landed cost checklist & calculation fields
Point: Unit price alone understates true cost. Evidence: landed cost fields must include unit price, shipping (express/standard), customs/taxes, payment fees, inspection/test cost, expected scrap and buffer stock carrying cost. Explanation: simple per‑unit landed cost = (unit_cost*tier_qty + shipping + customs + inspection + expected_scrap_cost + buffer_cost) / received_units. Maintain a CSV with those fields for quick comparisons across suppliers.
When a low listed price is a red flag
Point: Ultra‑low prices can conceal counterfeit or gray inventory. Evidence: common signs include missing manufacturer traceability, suspicious MOQ or packaging, inconsistent markings and lots listed across multiple sellers. Explanation: verification steps: request COA and lot photos, confirm traceability to manufacturer wafer/assembly lots, perform incoming inspection and test a small sample order before scaling purchases.
5 — Distributor Playbook & Procurement Recommendations
Distributor profiles & tactical sourcing (Digi‑Key, LCSC, X‑ON, marketplaces)
Point: Channels differ in price, speed and traceability. Evidence: authorized US distributors provide traceability and consistent lead‑times at modest premiums; marketplaces offer opportunistic low prices but variable provenance. Explanation: combine a reliable authorized distributor for production and an opportunistic channel for short‑term spot buys; avoid using unverified marketplace inventory for final assemblies without testing and COA.
Actionable checklist for procurement teams
Point: Concrete daily practices reduce sourcing risk. Evidence: implement daily price/stock monitoring, set alert thresholds, require traceability docs below price thresholds, apply sample‑first policy, and negotiate volume breaks or consignment for steady buys. Explanation: track KPIs—landed cost variance, fill‑rate, vendor lead‑time variance and incidence of nonconforming parts—to measure improvements and detect anomalies early.
Key Summary
- Disparate advertised price points reflect channel type and lot provenance; always calculate landed cost beyond unit price to reveal true procurement impact.
- Monitor price distribution statistics (min/median/max, IQR) and treat abrupt low prices as verification triggers to avoid gray or counterfeit stock.
- Adopt a dual‑channel sourcing strategy: secure production volumes via reliable distributor while using marketplaces for opportunistic, tested spot buys.
Common Questions
How should a buyer validate low‑price LM331A‑S5TR offers?
Ask for COA and lot photos, confirm packaging and markings against manufacturer references, request small sample shipments for functional test, and verify seller history and return policy before approving production use.
What landed‑cost fields are essential for comparator procurement?
Include unit price, shipping, import duties, payment fees, inspection/test costs, expected scrap, buffer stock holding cost, and any rework expenses. Capturing these fields per supplier enables apples‑to‑apples comparisons.
When is it acceptable to buy from a marketplace versus an authorized distributor?
Use marketplaces for low‑risk, noncritical, or prototyping buys after verification; for production or safety‑critical assemblies prefer authorized distributors with traceability, warranties and predictable lead‑times.