TPA6554 Datasheet Deep Dive: Specs, Noise & Gain Performance
The TPA6554-SO2R is notable for its wide low-voltage operating envelope and extended temperature rating; the datasheet lists a supply range of 2.5–5.5 V and an operating temperature from −40°C to +125°C. This article decodes the datasheet to clarify input-referred noise, noise spectral density, gain and bandwidth behavior, and provides concrete bench and PCB guidance so designers can verify performance and minimize noise in real systems.
TPA6554 at a glance: key specs pulled from the datasheet (Background)
Point: Identify the most relevant electrical and package information a designer needs first. Evidence: The datasheet enumerates package options, pin functions, supply limits and thermal ratings. Explanation: Start by noting package choices and pinout to plan breakout PCBs, then confirm absolute maximums and recommended operating conditions before schematic capture or layout.
Package & Pinout
Point: Package and pin descriptions determine layout constraints.
Evidence: The datasheet lists small-outline packages with defined pin functions for inputs, outputs, power and grounds and typically shows a recommended application block.
Explanation: Use the datasheet pin descriptions to map local decoupling placement, guard rings and ground returns on the PCB.
Electrical Limits
Point: Respecting electrical limits prevents device stress and distortion.
Evidence: Recommended supply is 2.5–5.5 V; characterization across −40°C to +125°C range.
Explanation: Treat absolute max values as one-time stress limits, design margins into supply and common-mode ranges.
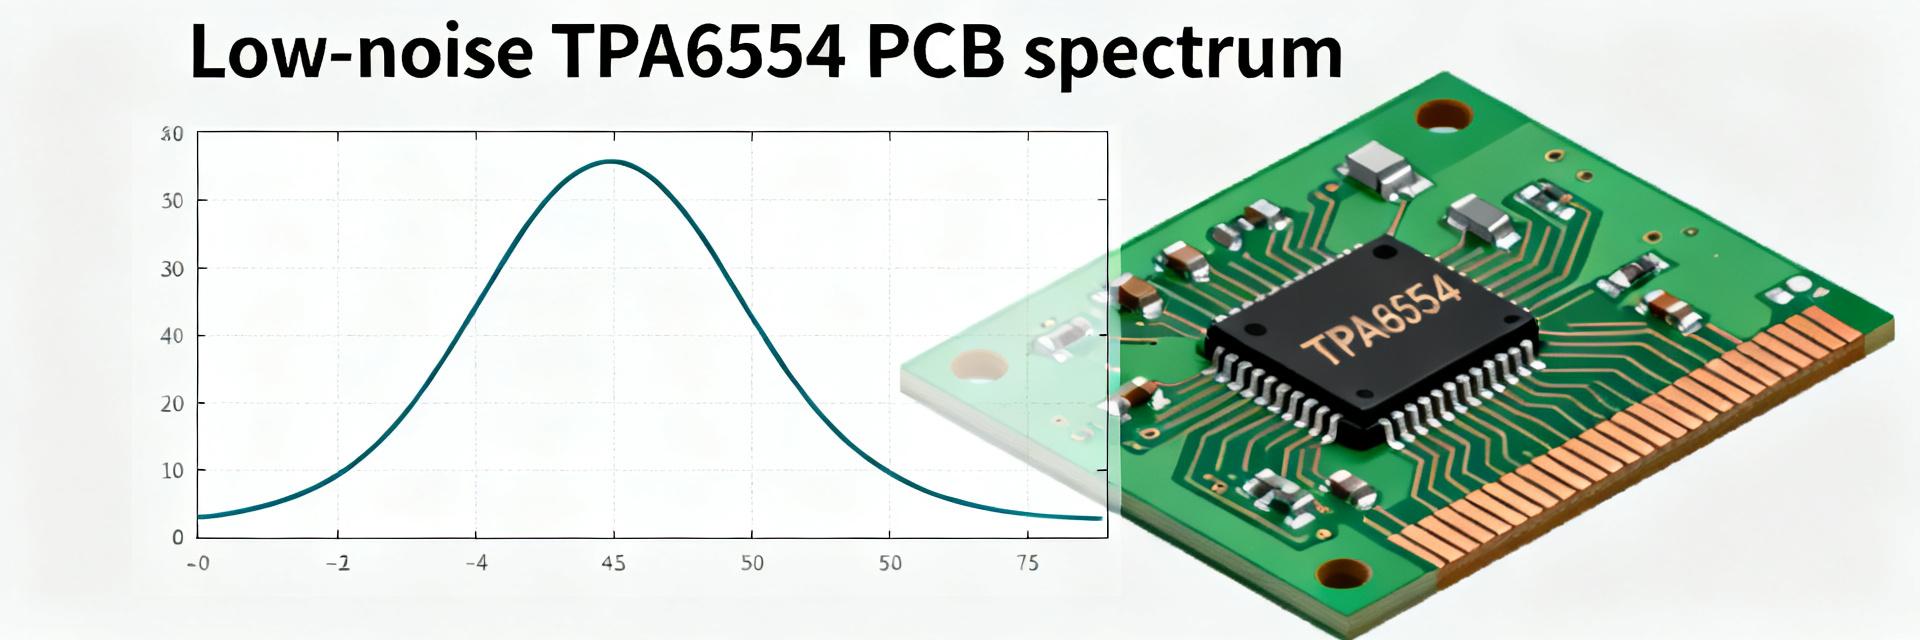
Noise performance breakdown: what the datasheet actually says (Data analysis)
Point: Noise specs are presented multiple ways; understanding them avoids misinterpretation. Evidence: The datasheet reports input-referred noise as both integrated rms values (over bands) and as noise spectral density traces or single-number nV/√Hz figures. Explanation: Integrated rms tells expected output noise for a defined bandwidth, while spectral density shows frequency dependence—both are needed to predict noise in your application.
Input-referred vs. Spectral Density
Point: Different metrics answer different design questions.
Evidence: nVrms assumes a test bandwidth; nV/√Hz gives per‑Hz contribution.
Explanation: Use spectral density to estimate noise for custom filters or sensors.
Typical vs. Guaranteed Specs
Point: Typical numbers are characterization results; guaranteed values are production limits.
Evidence: Labels "typical" with test conditions (supply, temp, load).
Explanation: Apply worst-case margins when relying on typical specs.
Gain, bandwidth and stability: extracting practical numbers (Data analysis)
Point: Datasheet gain and open-loop info determine closed-loop behavior and stability margins. Evidence: Gain tables, open-loop gain plots and phase margin notes indicate expected closed-loop gains and compensation behavior. Explanation: Read gain tables to select recommended closed-loop resistor ratios; inspect open-loop and phase plots to verify phase margin at your intended gain and load to avoid oscillation.
Closed-loop gain, open-loop parameters and margin considerations
Point: Closed-loop design relies on open-loop characteristics. Evidence: The datasheet shows typical open-loop gain and phase vs frequency and recommended feedback networks for stable gains. Explanation: Compute expected closed-loop bandwidth from the gain-bandwidth product implicit in the open-loop curve, and ensure at your feedback factor the phase margin remains >45° for robust transient and load behavior.
Frequency response, bandwidth vs gain tradeoffs, and slew-rate implications
Point: Bandwidth and slew rate limit large-signal and high-frequency performance. Evidence: The datasheet provides unity-gain or small-signal bandwidth and slew-rate figures, often measured at nominal supply and load. Explanation: For high-amplitude, high-frequency signals the slew rate can dominate distortion; choose closed-loop gain to place signals within linear bandwidth.
How to measure TPA6554 noise and gain on the bench (Method / guide)
Point: Accurate bench measurement requires careful setup. Evidence: Datasheet test conditions can be replicated with a low-noise source, proper grounding, and defined bandwidth; recommended instrumentation includes a spectrum analyzer or FFT-capable oscilloscope. Explanation: Use a PCB breakout with short traces, local decoupling, shielded wiring, and measure with defined bandwidth.
Recommended test setup and instrumentation
Point: Instrumentation and layout choices determine measurement credibility. Evidence: The datasheet’s noise-test setup implies low source impedance, specified load and bandwidth filters. Explanation: Use a low-noise voltage reference, matched load, and average traces to suppress analyzer noise floor.
Data capture, post-processing and common pitfalls
Point: Converting FFT output to meaningful nV/√Hz requires calibration. Evidence: Datasheet spectral plots assume specific input conditions. Explanation: Subtract instrument floor in quadrature, convert spectral bins to nV/√Hz, and watch for pickup from mains.
Design tips to minimize noise and optimize gain in real circuits (Method / guide)
Point: Layout and component choices materially affect final noise and gain. Evidence: Datasheet recommendations for decoupling and RRIO behavior guide practical choices; resistor noise and source impedance set theoretical floors. Explanation: Use low-value feedback resistors consistent with current budgets, minimize source impedance to reduce Johnson noise impact.
PCB layout, grounding and decoupling best practices
Point: Physical routing often dominates measured noise. Evidence: The datasheet emphasizes local bypass caps and clean ground references. Explanation: Place decoupling capacitors within millimeters of supply pins, use a solid analog ground plane, and route sensitive inputs away from digital switching.
Component choices, supply filtering and input termination
Point: Passive choices set the noise floor and stability. Evidence: The datasheet’s suggested input resistor ranges and recommended bypass networks. Explanation: Prefer metal-film resistors, keep feedback resistor values moderately low, and add RC input filtering where acceptable.
Practical checklist: when the TPA6554 is the right amplifier and when to look elsewhere (Case / action)
Point: Match application requirements against datasheet strengths and limits. Evidence: The device’s low-voltage operation, wide temp range and typical noise behavior make it suitable for battery-powered sensors. Explanation: Use the checklist below to decide fit: verify supply headroom, ensure noise floor meets system SNR, and confirm gain-bandwidth.
- ✔️ Use-case fit: Ideal for audio, sensor front-ends, and low-voltage systems.
- ✔️ Thermal check: Validate thermal margins on your specific PCB layout.
- ✔️ Red flags: Watch for noise exceeding budget after instrument floor subtraction.
- ✔️ Criteria: Insufficient phase margin or output headroom shortfalls under worst-case supply.
Summary / Conclusion
- Confirm supply and temperature envelope: the device supports 2.5–5.5 V operation and −40°C to +125°C; verify absolute maximums before layout.
- Interpret noise correctly: use noise spectral density to predict rms noise for your bandwidth and treat typical numbers as characterization.
- Balance gain vs bandwidth: extract closed-loop bandwidth from open-loop plots and verify phase margin at your feedback settings.
- Measure carefully: replicate datasheet test conditions on a low‑noise breakout, use averaging, and calibrate instrument floor.
- Practical steps: apply tight decoupling, low‑impedance inputs, metal‑film resistors, and supply filtering to preserve gain fidelity.
Frequently Asked Questions
How do I reproduce the datasheet noise measurement?
Recreate the datasheet test conditions: use the same supply voltage and load, low‑impedance signal source, specified bandwidth, and an FFT analyzer. Average multiple captures and subtract instrument floor in quadrature.
What closed-loop gain should I choose for stable operation?
Select a closed-loop gain supported by the datasheet’s recommended resistor ranges. Aim for a phase margin >45°; when in doubt, add small compensation capacitors in the feedback network.
Which PCB practices most reduce input noise?
Key practices: place decoupling caps adjacent to supply pins, minimize input trace length, use a solid analog ground plane, and choose low-noise resistors.